Understanding Feynman Diagrams: An In-Depth Look at g-Factor Corrections
Written on
Chapter 1: Introduction to Feynman Diagrams
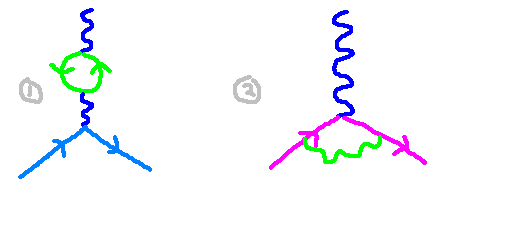
In our previous discussion, we introduced a diagram that illustrates the correction to the magnetic g-factor. This diagram features a loop structure, where a photon connects the momenta of the electrons, forming a single closed loop with momentum ( k ). To derive the amplitude from this diagram, we will employ Feynman rules. While the diagram may appear intimidating, I will clarify each component step by step.

In the diagram above, we see an example of two distinct sub-processes used to analyze the scattering between an electron and a photon. Next, we will explore how to explicitly calculate the amplitude associated with the second diagram.
Section 1.1: Understanding the Electron Propagator
When an electron line appears in a diagram, we associate it with the electron's propagator. This propagator reflects the probability amplitude of generating an electron at point ( x ) and having it terminate at point ( y ). In the equation below, the spinor fields, represented by the Greek letter psi (( psi )), denote the initial and final states of the electron. The creation of the electron at point ( x ) is represented by its application to the ground state, hence its proximity to zero in the brackets. Similarly, the appearance of the electron at point ( y ) is denoted by the spinor evaluated at ( y ). The final propagator is the contraction of these two states.

The expression on the right illustrates our propagator in momentum space. The term ( T ) in the middle expression signifies a time-ordering operator, which is a more nuanced mathematical concept that we will not delve into here. To compute the integrand, we first expand the spinors at points ( x ) and ( y ) separately, which yields a complex array of terms. After mixing these terms, many simplify due to the relationships between the creation and annihilation operators, leading us to the expression for the electron propagator.
Section 1.2: Analyzing the Photon Propagator
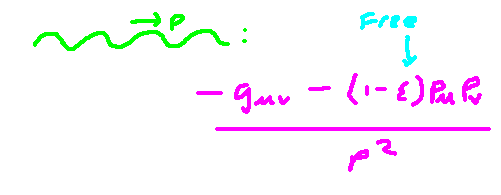
We follow a similar approach for the photon propagator, which involves the vector potential ( A ) instead of the spinors used for the electron. While the calculation is akin to the previous one, Fourier transforms often provide simpler methods. However, it is important to note that there exists a degree of 'gauge freedom' in defining the propagator, a concept that arises from the symmetries of electromagnetic theory, denoted by the Greek letter ( Xi ).

Chapter 2: Computing the Full Diagram
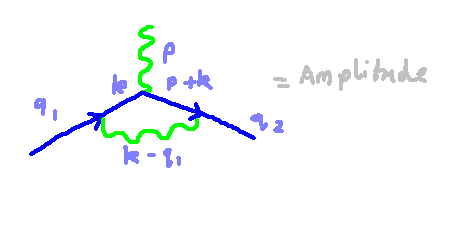
Our diagram comprises three vertices, which are the intersection points of the lines, each contributing a scaling factor to the total amplitude known as the coupling constant. The more vertices present, the less significant their overall contribution to the process. At each vertex, momentum conservation must hold, meaning the total momenta entering and exiting must balance.
In the diagram, we identify three external legs—two associated with electrons and one with a photon. We pre-define the momenta ( q_1 ), ( q_2 ), and ( p ) for these external legs. By performing some calculations, we discover that there is one undetermined momentum, which we will label as ( k ).

In addition to the external legs, our diagram contains three internal propagators: two for electrons (one with momentum ( k ) and another with ( p+k )) and one for the photon with momentum ( k-q ). All these momenta are illustrated in the diagram above. To compute the overall amplitude, we multiply these propagators together in a comprehensive expression and integrate over the free momentum ( k ). The expression below provides a rough schematic of the total amplitude.

The actual mathematical formulation is intricate, with the denominator comprising three distinct factors derived from the propagators. The first factor includes the term ( (k-q_1)^2 ) linked to the photon propagator, while the other factors depend on the momenta of the incoming and outgoing electron propagators. The numerator results from the electron propagators and several intermediate terms arising from the vertices.

Evaluating this expression is a challenging task. Fortunately, techniques such as Feynman’s integral trick can help simplify the process. I will discuss these strategies in the following section.
This video titled "Feynman diagrams" offers a comprehensive overview of how these diagrams operate within quantum field theory.
The second video, "Feynman Diagrams and Perturbation Theory: Calculating in Particle Physics," delves deeper into the mathematical intricacies and applications of Feynman diagrams in particle physics.
References
[1] Schwartz, Matthew D. (2024). Quantum Field Theory and the Standard Model. ISBN: 8601406905047