Understanding the Chi-Square Test: An Insightful Guide
Written on
Chapter 1: Introduction to the Chi-Square Test
The Chi-square test is a statistical method often encountered in various scientific and corporate contexts. If you've studied for standardized tests like the SAT or worked in research, you might have come across this term. Organizations frequently utilize the Chi-square test when making critical decisions in fields such as healthcare, product design, and engineering.
Before delving into the Chi-square test, it’s essential to grasp the concept of hypothesis testing, as the Chi-square test is a specific type of hypothesis test. While it may seem tedious to understand these foundational concepts first, mastering hypothesis testing will pave the way for comprehending various statistical tests, including the t-test, Z test, and Wilcoxon’s test.
Many of the terms associated with hypothesis testing, such as null and alternative hypotheses, type 1 and type 2 errors, degrees of freedom, and p-values, may make the Chi-square test appear complex. However, the core concept of hypothesis testing is straightforward and intuitive.
What is Hypothesis Testing?
Hypothesis testing involves statistical analysis that examines samples to determine if the results can be generalized to the entire population. Since samples are merely subsets of a larger dataset, there's always a degree of uncertainty in the test outcomes. Essentially, hypothesis testing aims to navigate through this randomness and arrive at conclusions that we can trust.
To make this concept more memorable, let’s visualize it with an example. Suppose you are Steve Jobs in 2007, working on the first iPhone, and you want to assure customers that the battery lasts 24 hours. Given the importance of this claim, you need accurate data to support it.
You travel to China to measure the battery life of the iPhones coming off the production line. Naturally, it’s impractical to test every device, so you sample a few. Interestingly, the average battery life fluctuates daily, ranging from 24.5 hours to 23.7 hours, depending on the sample size.
This variability poses the question: how can you be certain that the average battery life is indeed around 24 hours and not just a product of random sampling? Hypothesis testing is the answer.
Through hypothesis testing, you can statistically determine if the average battery life aligns with your claim of 24 hours with a certain level of confidence (e.g., 95%, 99%).
Hypothesis Testing Steps
- Formulate the Hypotheses: Establish a null hypothesis (H0) and an alternative hypothesis (H1). The null hypothesis typically asserts that there is no effect or difference, while the alternative suggests otherwise.
- Set the Significance Level (α): This value, such as 1% or 5%, represents how much weight you give to the alternative hypothesis.
- Calculate the p-value: This statistic helps determine the strength of your results in relation to the null hypothesis.
- Make a Decision: Based on the p-value and significance level, either reject or fail to reject the null hypothesis.
In the next section, we will explore how the Chi-square test fits into this framework.
Chapter 2: The Chi-Square Test Explained
The Chi-square test is a specific type of hypothesis test that assesses whether two categorical variables are associated. For instance, it can help determine if there is a relationship between educational attainment and income.
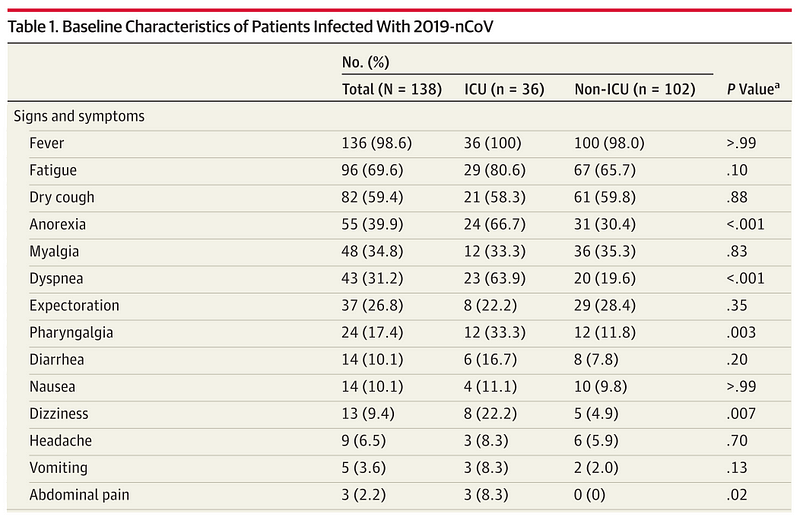
Let's look at how the Chi-square test can be applied using data related to COVID-19 symptoms and ICU admissions.
In the first video, "How To... Perform a Chi-Square Test (By Hand) - YouTube," you will learn how to conduct a Chi-square test manually, providing a foundational understanding of the process.
The second video titled "Chi-squared Test - YouTube," goes further into the implications of the Chi-square test in various scenarios, enhancing your comprehension of its applications.
Step-by-Step Calculation of the Chi-Square Test
To perform a Chi-square test, follow these steps:
Create a Contingency Table: Organize your data into a format that allows for easy comparison.

Calculate Expected Values: For each cell in your table, compute the expected value based on the assumption that there is no association between the variables.
Apply the Chi-Square Formula: Use the formula (chi^2 = sum frac{(O - E)^2}{E}) where O is the observed frequency and E is the expected frequency.
Determine Degrees of Freedom: This is calculated as ((text{Number of rows} - 1) times (text{Number of columns} - 1)).
Find the p-value: Use statistical software or a Chi-square distribution table to compare your calculated statistic.
Make a Decision: Based on the p-value, decide whether to reject the null hypothesis.
Conclusion
The Chi-square test is a powerful tool for analyzing categorical data, providing insights that can inform decision-making in various fields. Understanding hypothesis testing is crucial for effectively utilizing the Chi-square test and other statistical methods in your work.
By applying these concepts, you can explore questions in your everyday life, enhancing your analytical skills. Consider formulating your hypotheses and testing them in a controlled manner to see how statistical analysis can be applied outside of academic settings.
Special thanks to those who provided feedback on this guide, helping to refine and improve its content.