Analyzing Expected Threat: Insights into Transition Metrics and Player Performance
Written on
In football analytics, estimating the efficiency of attacking actions during the build-up phase can be approached in three different ways:
- Metrics relying on Expected Goals (xG): xGChain and xGBuildup
- Metrics utilizing Markov Chains: Expected Threat (xT)
- Metrics based on Machine Learning techniques: VAEP, OBV, PV, g+, EPV
This article will focus on the first two methods, using specific examples to illustrate their strengths and weaknesses.
- Metrics Based on xG
xGChain (xGC) is defined as the total xG values accumulated through all possession chains in a match that ended in a shot. This metric is calculated for individual players.
In essence, the xG from each attacking sequence is allocated to all players who participated in that sequence, culminating in the xGChain for a specific match.
For instance, one possession chain from Barcelona’s match against Real Madrid on 10-28-2023 featured six key actions: Gündogan's pass to Yamal, Yamal’s carry and pass to Lewandowski, Lewandowski's pass to Rafinha, a back pass to Lewandowski, and finally, a shot.
The xGChain for each player is then summed to produce an overall estimate. This metric is available for free on understat.com, typically calculated only for open-play possessions, excluding set pieces. Understat provides xGChain OP, though this is not explicitly stated.
At the conclusion of the El Clasico, players received the following xGChain scores.
The xGChain scores demonstrated a significant imbalance among Real Madrid players due to a lengthy attack during stoppage time, culminating in a goal by Jude Bellingham. The corresponding possession chain involved 13 passes and a crucial touch by Modric, involving nine players, each receiving an xGChain of 0.57.
The evaluation of each player’s contribution to the goal can vary significantly; Rudiger and Alaba's assessments should not equate to Modric's, who orchestrated the attack through multiple passes and a crucial assist.
In addition to xGChain, there’s another xG-based metric available on understat.com called xGBuildup. This is calculated similarly to xGChain but excludes the assist and shot actions, focusing instead on the buildup phase. For example, while Jude only received a score of zero for his shot, Modric's contributions during the buildup maintained an xGBuildup of 0.57.
While both metrics are valuable for evaluating a player's contribution to offensive threats, they exhibit limitations: - They only account for actions within possessions that conclude with a shot. - Each player involved in a possession is given the same score.
- Expected Threat (xT)
The xT metric evaluates the likelihood of scoring a goal based on the movement of the ball between two points on the pitch, considering subsequent actions. It assesses the impact of passes and carries on the potential threat to the opponent's goal.
By aggregating xT values throughout a match, we can gauge each player's contribution to the overall offensive threat. The values can also be totaled for teams to derive a final score.
Two key distinctions set xT apart from previous metrics: - It evaluates any action that advances the ball, regardless of whether a shot occurs. - It assigns independent scores to each action, meaning players won’t receive inflated ratings for insignificant contributions.
In simplified terms, xT measures the change in the likelihood of a potential shot occurring after a series of actions, moving the ball from point A to point B.
One practical application of xT is creating a graph to illustrate the cumulative xT values for each player during a match.
The foundation of xT lies in the transition matrix, calculated from historical data on shots, goals, and ball movements (passes and carries). The number of subsequent actions after the evaluated action is crucial when preparing the transition matrix.
Additionally, the dimension of the transition matrix used for xT calculations is vital. Without knowledge of the matrix utilized, it is often challenging to accurately compare xT values.
Various transition matrices can be found online:
Original Karun’s Transition Matrix Karun Singh, a data scientist at Arsenal FC, created an expected threat model. The original matrix can be found on his Twitter, although details about the number of actions used are absent. This matrix is based on EPL statistics from the 2017-2018 season.
Each matrix cell represents the xT value for specific areas, indicating the likelihood of scoring a goal based on the zone occupied by the ball after several actions.
To derive the xT value for any pass or ball movement, subtract the xT of the starting area from that of the destination area. For instance, a successful pass from a corner area to the penalty area might yield an xT of 0.11–0.04 = 0.07 xT.
Another matrix provided by Karun has high granularity and indicates the probability of scoring after five subsequent actions. Using this matrix for a pass from the right corner flag to the penalty area yields an xT estimate of 0.176 – 0.068 = 0.108.
This value suggests that the pass increased the probability of scoring by 10.8% within the next five actions. For clarity, this metric can be viewed as an indicator of the likelihood of scoring resulting from a pass or carry.
The effectiveness of the metric can be illustrated interactively in Karun’s original article, allowing users to change the number of actions considered and observe the variations in probability across different areas of the pitch.
As the number of actions decreases, changes in xT values near the goal remain minor, while variations across other field sections are more pronounced. For instance, fixing the number of actions at three increases the scoring probability from a corner to the penalty area to 0.133 or 13.3%.
This underscores the importance of specifying which transition matrix was used in xT evaluations. The same pass can yield different xT estimates based on various matrices, depending on their granularity and action count (7%, 10.8%, and 13.3%).
Twelve Transition Matrix Another transition matrix from @jernejfl (Data Scientist at Twelve Football) features an even higher dimension of 21 cells across 17 zones. While some YouTube videos recommend using this matrix for xT evaluation, details on its development are scarce.
In the following video, the channel's creator notes that extensive match statistics were utilized in constructing this matrix, with each cell reflecting the probability of scoring from that position.
Comparing similar areas in the first and Twelve matrices reveals that the latter has lower values. Increased granularity often results in the splitting of high-value cells, leading to significant discrepancies in xT estimates for identical passes.
Athletic Transition Matrix In a 2021 article, The Athletic published another transition matrix derived from three EPL seasons (2018-2021). The author provides various ratings based on the xT metric, including a list of the best players in the Premier League according to this metric, based on 90 minutes of play for passes and carries.
Separate ratings highlight the most threatening passers (only xT for passes) and best carriers by xT.
I aimed to create a new transition matrix and validate the method for calculating final xT values based on The Athletic's ratings.
Important Details Using previously discussed matrices may not be entirely valid for several reasons: - Karun’s matrices were built on a single EPL season's data (which may be outdated). - There are no specifics regarding the Twelve matrix's data sources or time frame, suggesting it may also be outdated.
While I lack data on how shot patterns evolve season by season, it’s evident that trends in shots and movements on the pitch change over time. An interesting article from MIT Sloan Sports Analytics 2021 demonstrated trends in average shot distance in the EPL over a six-year span, highlighting that the coordinates and shot statistics directly impact the calculated xT for each zone. This indicates that transition matrices need to be updated regularly.
It’s also essential to consider that different authors may utilize varying data sources (StatsBomb, Opta, Wyscout) and preprocess the data differently, leading to discrepancies in the resulting matrices.
To illustrate, let’s compare two matrices of equal dimensions from Karun and The Athletic.
This comparison reveals that direct comparisons of xT metrics from different authors are flawed if they rely on different transition matrices.
Validating the Calculation Method for Passes and Carries Utilizing The Athletic matrix, I attempted to calculate similar ratings based on Opta event data. However, data from whoscored.com lacked carry event types, limiting the creation of a comprehensive transition matrix.
Nonetheless, carries were present in possession chains. I interpolated values between events to "restore" carries for all players.
Subsequently, I filtered for ball-moving actions: passes, carries, and take-ons in open play, excluding crosses to mitigate bias against full-backs and wingers.
The subsequent steps involved applying the completed actions to the transition matrix, calculating final xT values by deducting initial zone values from final zone values.
I also calculated full-time for all 2020-21 EPL matches, including stoppage time, as other sources may provide total minutes without extra time, affecting total metrics.
Finally, I normalized the xT values for 90 minutes, focusing on players with more than 900 minutes on the field. The results are illustrated below.
Comparison with original ratings from The Athletic indicates a high degree of similarity. Almost all top 20 players from The Athletic’s list appear in my results, with a few exceptions.
Let’s examine the ratings for carries.
Here, the results demonstrate less consistency with the original ratings. For example, Raheem Sterling ranked second behind Grealish instead of Curtis Jones and Aaron Connolly. However, the majority of key players were accurately recovered, despite the inherent challenges of data interpolation.
Finally, let’s analyze the combined ratings for carries and passes.
The comparison with The Athletic’s original rankings shows that only one player from their list is missing in my results. Overall, the findings closely align:
- Jack Grealish ranks first with a significant lead.
- The remaining players, with a few exceptions, are clustered closely in their rankings.
In conclusion, we successfully validated the technique for preprocessing event data and evaluating xT using the transition matrix.
Creating a New, Up-to-Date Transition Matrix A detailed guide for constructing a transition matrix can be found at the provided link. Below is a brief overview of the process:
- Scrape data from the top five leagues for the last five completed seasons (2018-2019 to 2022-2023) using whoscored.com.
- Recover carries for all matches, following the definition from Opta (any ball movement exceeding five meters).
- Create a dataset for actions moving the ball (passes, carries, take-ons), focusing only on open play and excluding crosses.
- Establish separate datasets for shots and goals, again limiting to open play actions.
- Conduct calculations as outlined in the linked course by soccematics and David Sumpter to produce final transition matrices, considering five subsequent actions.
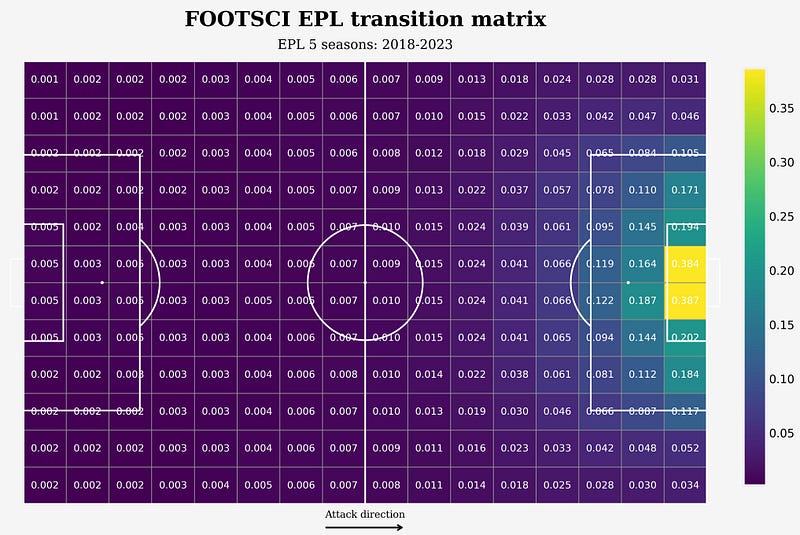
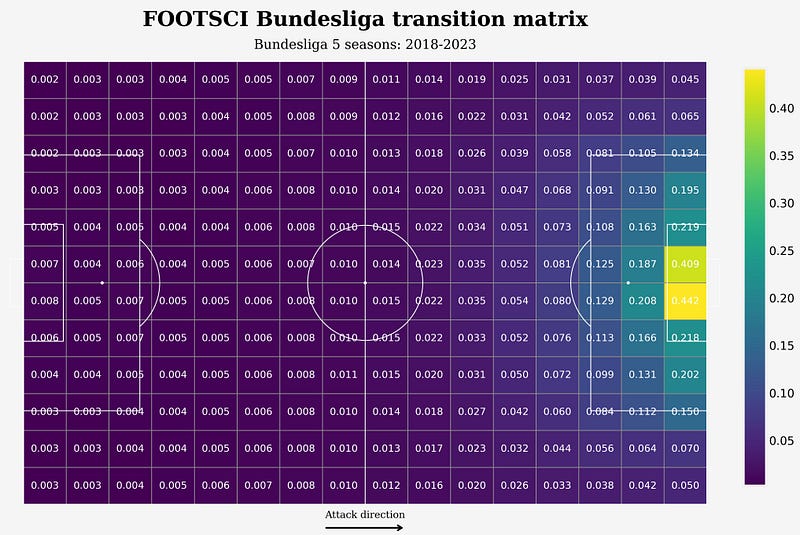
I aim to create distinct matrices for each of the top five leagues and a final matrix representing all leagues, facilitating visual comparisons.
EPL
Bundesliga
LaLiga

Ligue 1

Serie A
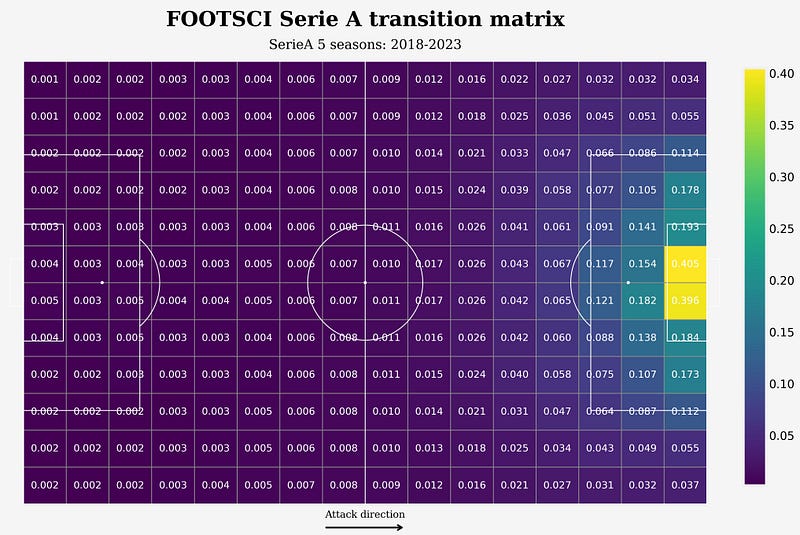
The final matrix for the top five leagues will serve as a foundation for future visualizations in this and subsequent articles.
Applying the xT Metric Returning to the recent El Clasico, we will analyze two possession chains and evaluate each action's contribution using the xT metric.
If all participants in previous attacks received the same low xGChain score, the xT metric provides a clearer picture of each player's individual contributions to the threat created.
For example, Yamal achieved an xT of 0.032 for two actions advancing the ball into a dangerous area, while Gündogan’s initiating pass earned him an xT of 0.009. Lewandowski's contributions were valued lower at 0.006 and 0.007 for his respective passes.
These results indicate that Lamin Yamal boosted the likelihood of scoring by 3% through his actions, marking him as the most impactful player in the attack per the xT metric.
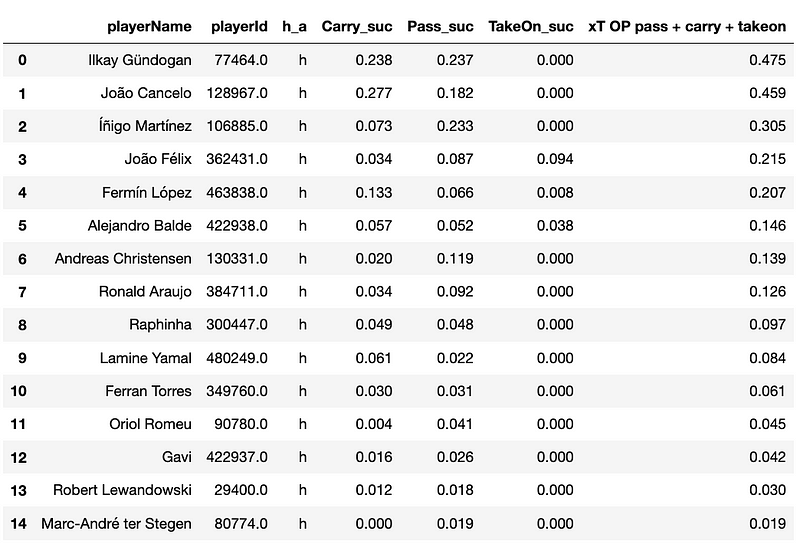
We can also utilize xT to analyze all ball progressions by Barcelona players, identifying those who most effectively moved the ball from low-risk zones to high-probability scoring areas.
The table below summarizes the total xT values for all Barcelona players during the match, based on three types of actions (passes, carries, and take-ons).
The most effective possession for Real Madrid, according to the xGChain metric, is detailed below.
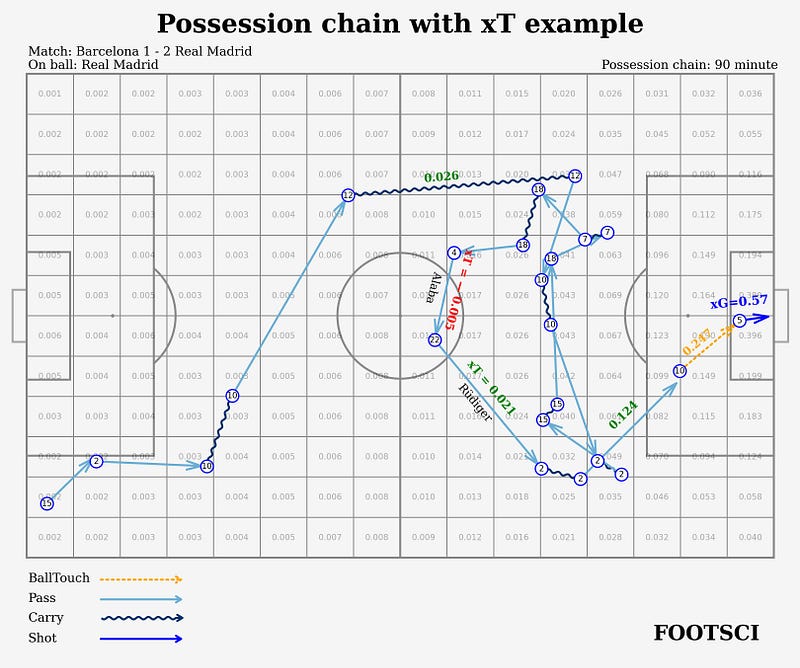
The top three actions by xT within this possession included: - A pre-assist pass from Carvajal to Modric in the penalty area (xT = 0.124), demonstrating the metric's utility in evaluating critical pre-assist actions. - Camavinga’s carry during the initial phase of the attack (xT = 0.026). - Rudiger’s pass to Carvajal, which facilitated Modric's pass to the penalty area (xT = 0.021).
While there may be a temptation to apply the xT metric to Modric's assist (potentially yielding a high value of xT = 0.247), it is important to note that Opta categorizes this as a BallTouch, not a pass, thereby negating its inclusion in standard evaluations.
The contributions of all actions within this possession are summarized in the table below.
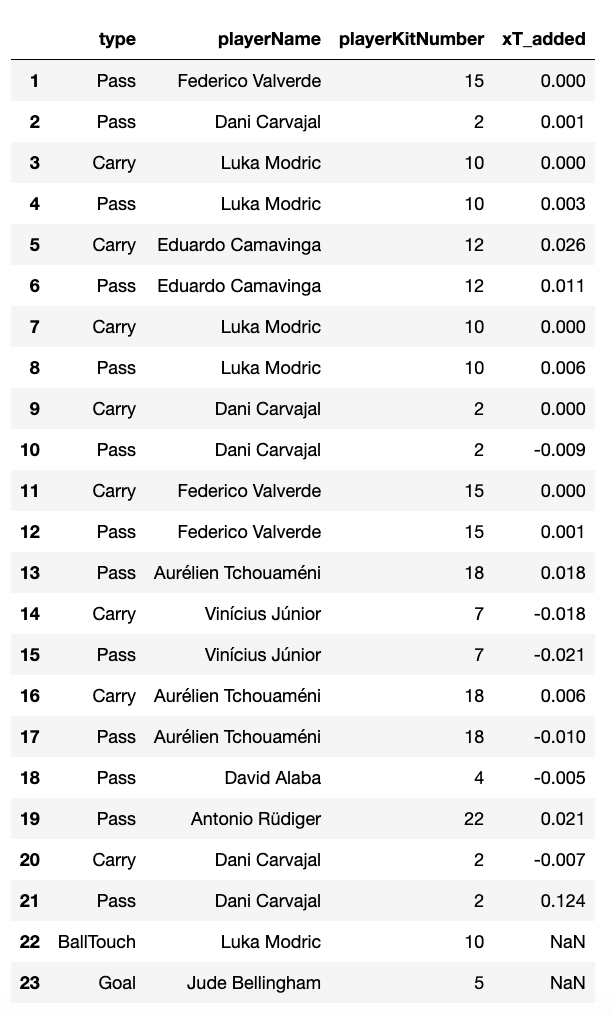
It is also worth mentioning that Alaba’s pass received a negative value. Given the limitations of the xGChain metric, this pass, which was pivotal in the attack, received a notably high positive rating.
On one hand, it may seem appropriate to penalize a backward pass with a negative score; typically, actions rated negatively are excluded from final assessments.
Conversely, this highlights a notable flaw in the xT metric—most backward passes are assigned negative values.
Importantly, other metrics based on machine learning do not have this issue, which will be explored in future articles.
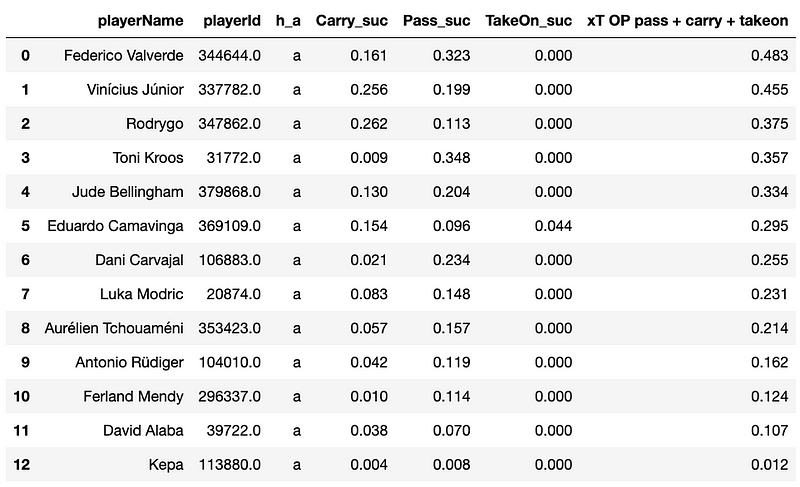
All Real Madrid players' contributions are summarized in the table below according to the xT metric (excluding Modric’s xT for BallTouch).
Top Football Players in Europe by xT Metric (as of December 6, 2023)
To conclude, we will review the current rankings of Europe’s leading football players in terms of the offensive threats they create through ball movement.
Data was scraped from whoscored.com for the top five leagues during the current season, using the previously established transition matrix to compute final ratings.
However, it is important to note that my transition matrix aligns more closely with the original model than with The Athletic's matrix, making direct comparisons between the two ratings inaccurate.
For instance, in The Athletic’s rankings, Grealish’s maximum per 90 minutes was 0.34 xT, while my updated rating assigns him 0.83 xT.
Top Football Players in Europe for Creating Threats through Passes and Carries in the TOP5 Leagues
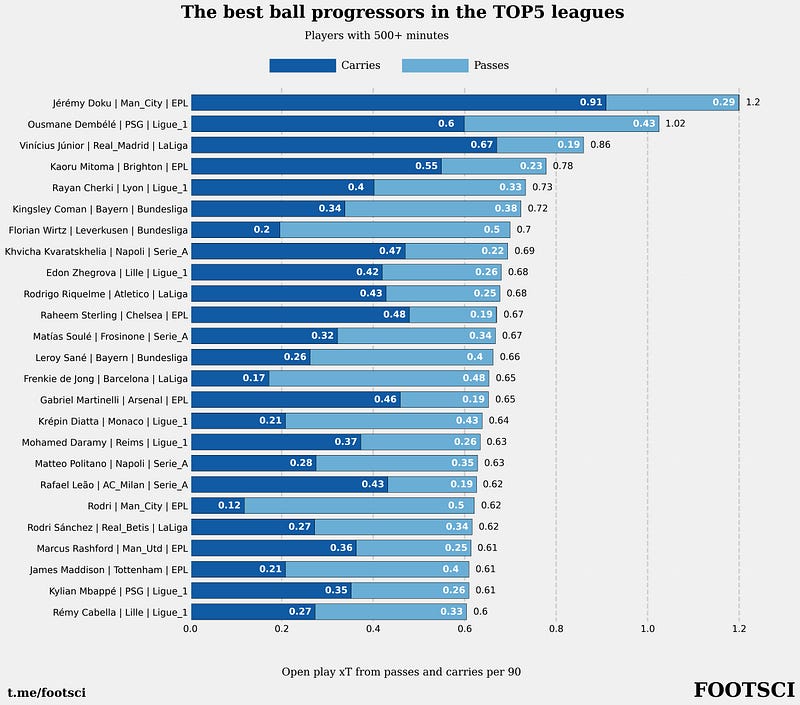
The resulting ranking consists of: - 7 players from both the Premier League and Ligue 1 - 4 players from La Liga and Serie A - 3 players from the Bundesliga
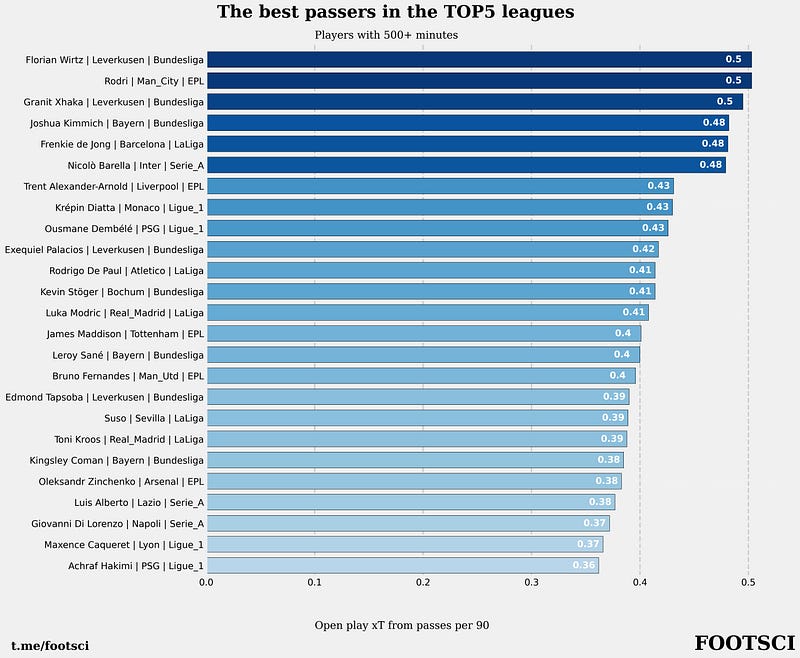
Top Football Players in Europe for Threats Created through Passes in the TOP5 Leagues
Top Football Players in Europe for Threats Created by Carrying the Ball in the TOP5 Leagues
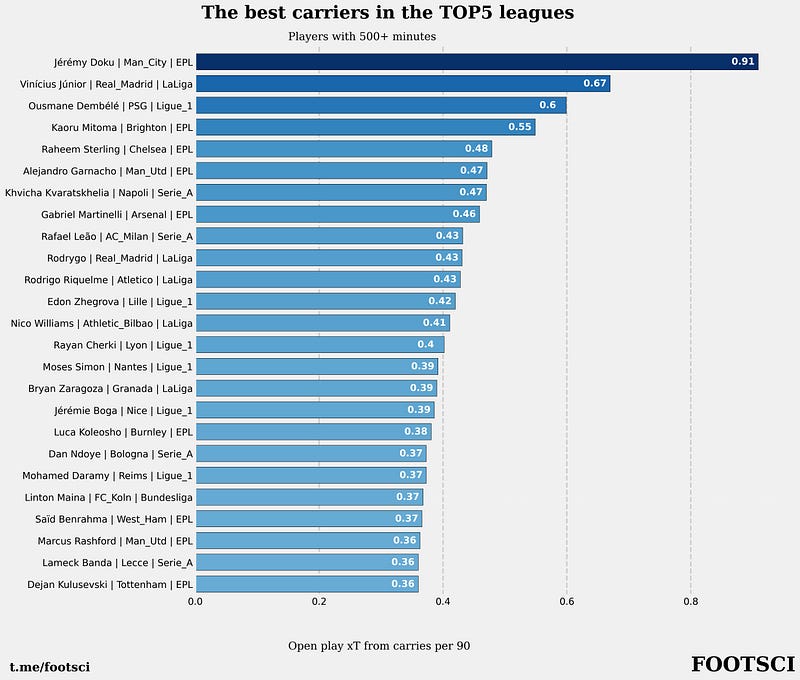
In summary, the distribution of players includes: - 9 from the Premier League - 6 from Ligue 1 - 5 from La Liga - 4 from Serie A - 1 from the Bundesliga
P.S. In the upcoming article, we will delve into constructing a passing map using event data, incorporating the xT metric as an additional layer.